From Uptrend to Distribution: The Emerging Bearish Structure in the S&P 500

Since late 2025 the S&P appears to be putting in a classical topping pattern. This pattern typically occurs near the end of a sustained uptrend when buying momentum begins to fade and sellers gradually take control of the market. During this phase, price typically struggles to make new highs and instead forms repeated tests of a resistance level, creating structures such as a double top, head-and-shoulders top, or broad distribution range. These patterns reflect a shift in market psychology, early buyers start taking profits while new buyers become hesitant, causing volatility to increase and price swings to widen. Eventually, the pattern is confirmed when price breaks below a key support level signaling that demand has weakened and that a potential downward trend may follow. Classical topping patterns are important in technical analysis because they often mark the transition from a bullish phase to a bearish phase, helping traders anticipate possible declines and adjust their positions accordingly.
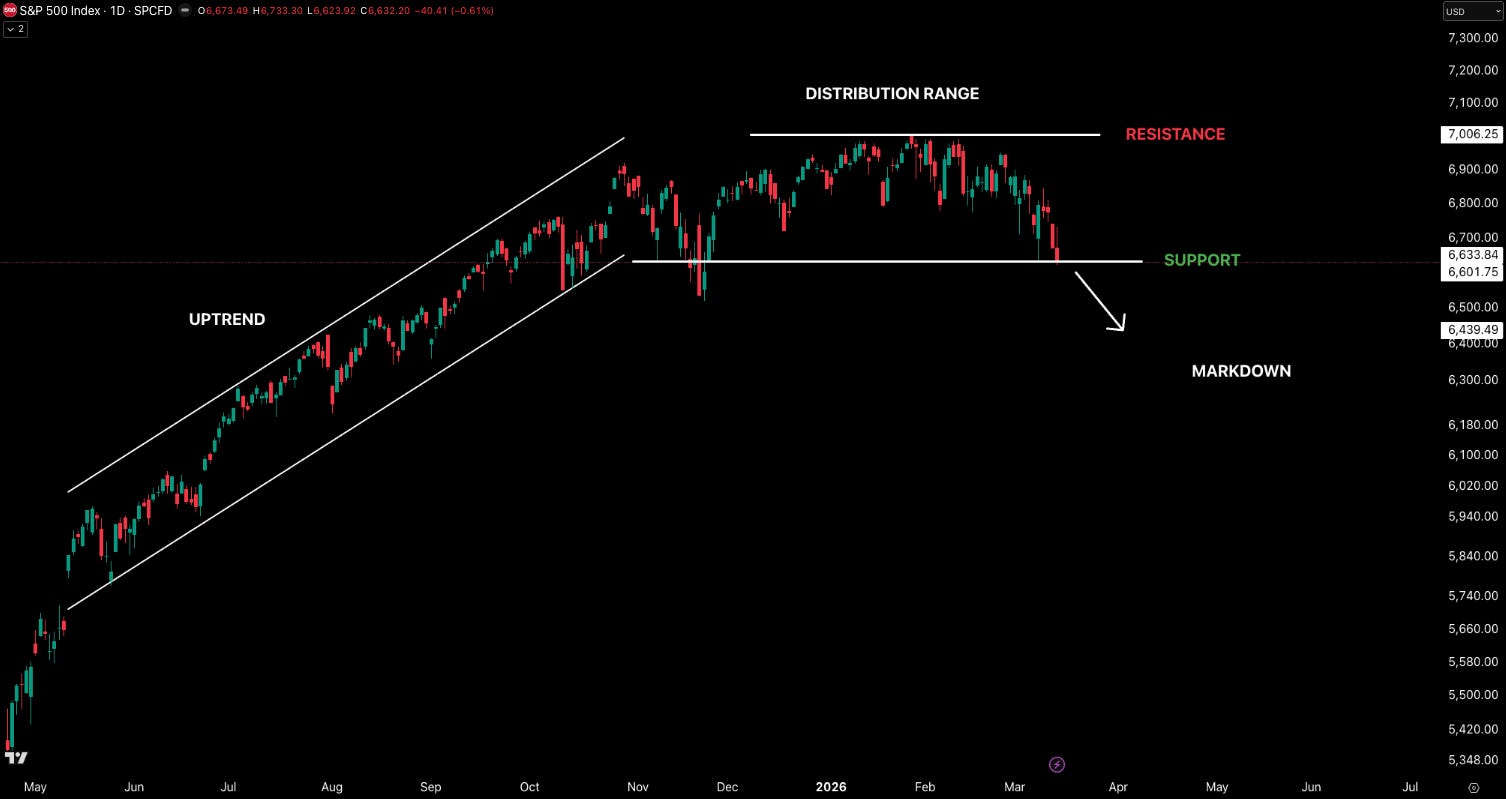
From the start of the chart above, the S&P 500 Index was in a clear uptrend, steadily making higher highs and higher lows through mid-2025 into early 2026, reflecting strong bullish momentum. As the market approached the ~7000 level, price began to stall and move sideways with multiple attempts to push higher, creating a distribution range where large participants were likely selling into strength. Volatility increased near the top, producing wider swings and signaling a weakening of trend control, and the structure gradually shifted from higher highs to lower highs, indicating momentum to the upside was lost. Price is now at a key support level ~6633. A break of this level confirms the distribution phase has ended and the market is transitioning into a potential markdown phase.
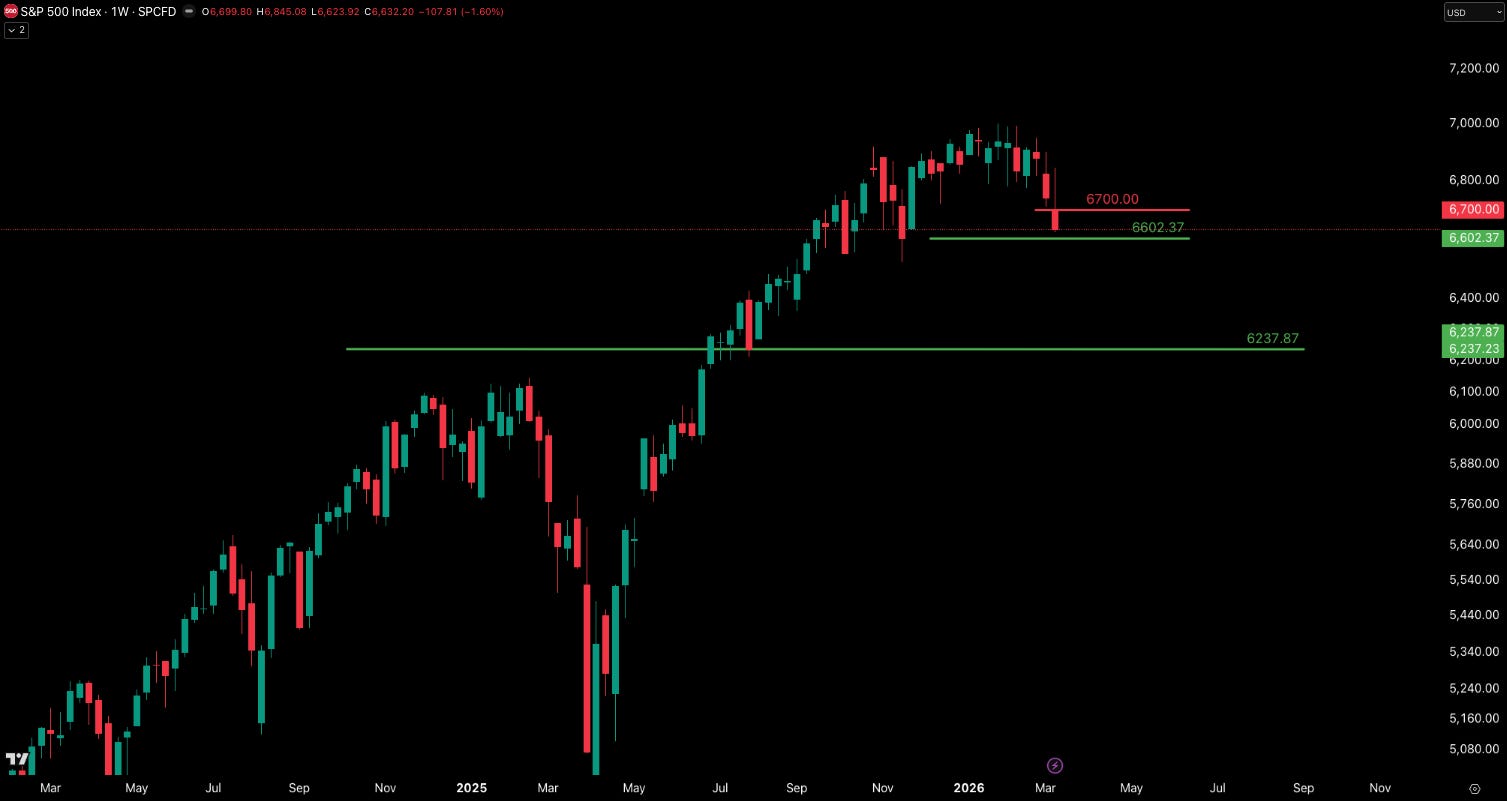
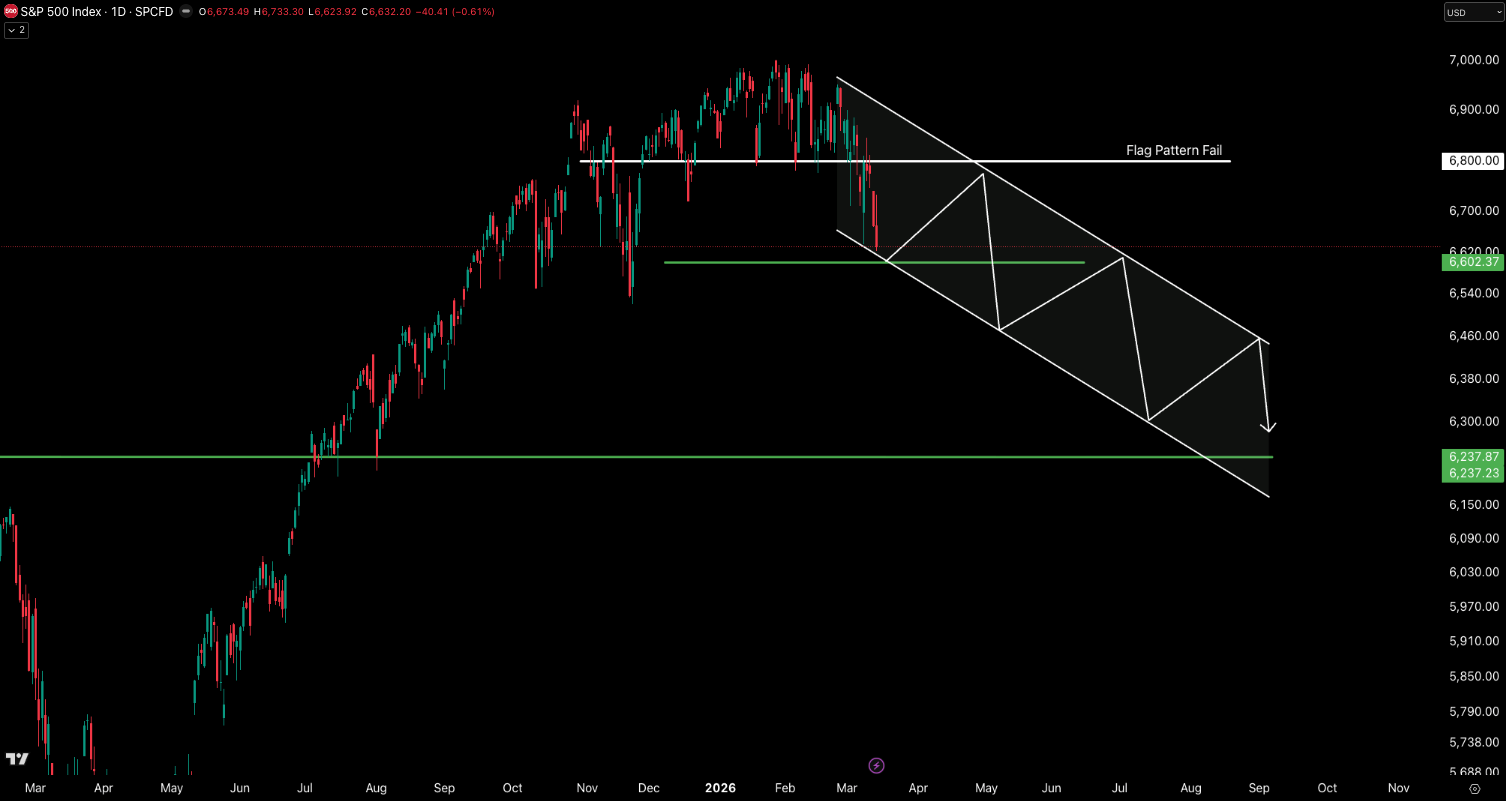
We are approaching a strong support level around 6602, which could result in a bounce and potentially mark the beginning of a series of lower highs and lower lows. I am anticipating the possibility of a bear flag continuation pattern. If price fails to reclaim the broken range and instead breaks lower again with strong volume, the pattern would suggest a second leg down toward roughly 6300–6200. However, a strong reclaim above 6800 would invalidate the bearish continuation pattern and instead suggest a short squeeze and a possible retest of the highs.